Lumen is strongest when data is a flat table. Most scientific data is a cube.
This project made xarray a first class citizen in Lumen, and fixed the layer
underneath it when that layer could not carry the weight.
A SQL source that reads NetCDF and Zarr in place, agents that draw a grid as a
grid, and pipelines that no longer assume pandas. About a third of it landed
upstream, in the projects Lumen sits on rather than in Lumen itself. All of it was
driven against real climate and geospatial files rather than fixtures, which is how
most of the interesting bugs were found in the first place.
Every pull request, placed by the week it landed and the workstream it belongs to,
against the official GSoC 2026 calendar. Click any cell to filter the index at the
foot of the page.
The 350 funded hours run from 25 May to 24 August. The columns left of that mark
are the ramp up that earned the project: 26 merged pull requests before the coding
period opened, including the two that became goals 4 and 5.
Every claim on this page links to the pull request that backs it. States and diff
sizes are read from the GitHub API, not typed by hand, so a chip that says
merged is merged. If you have five minutes, read
the round trip and the real data.
For the proposal scorecard go to goals, and for every change
in one sortable place, the index.
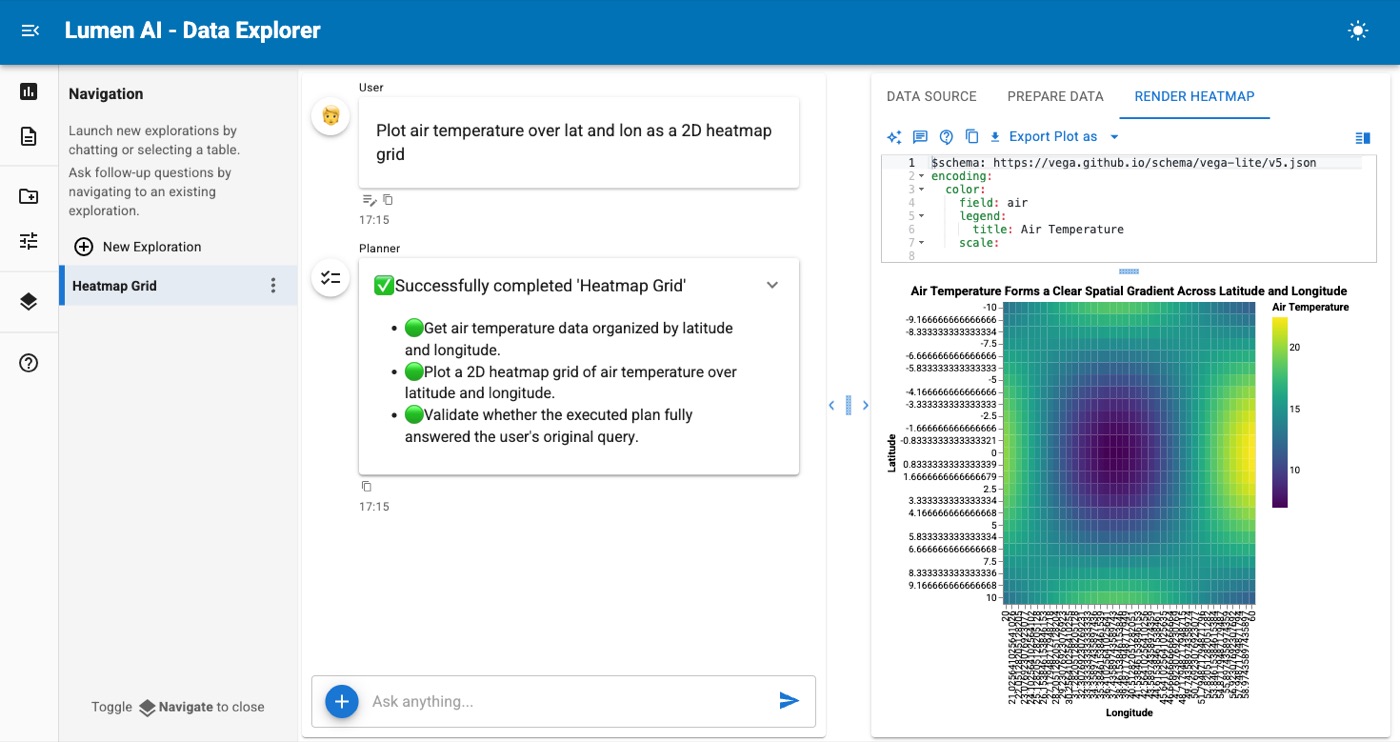
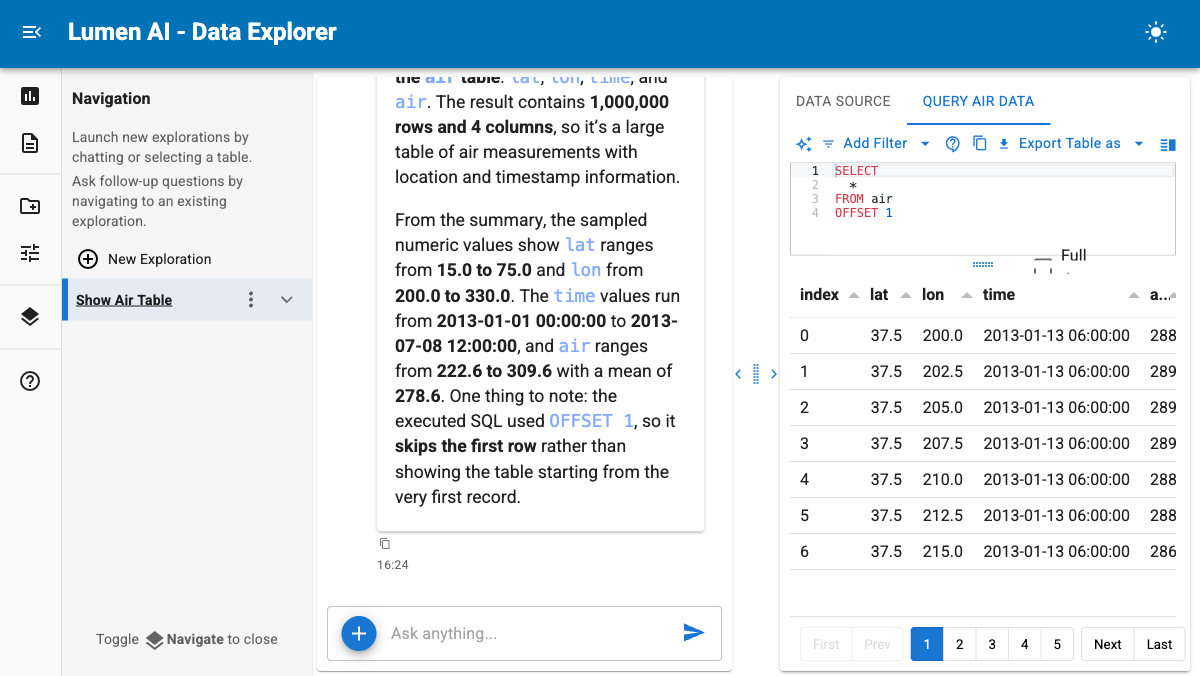
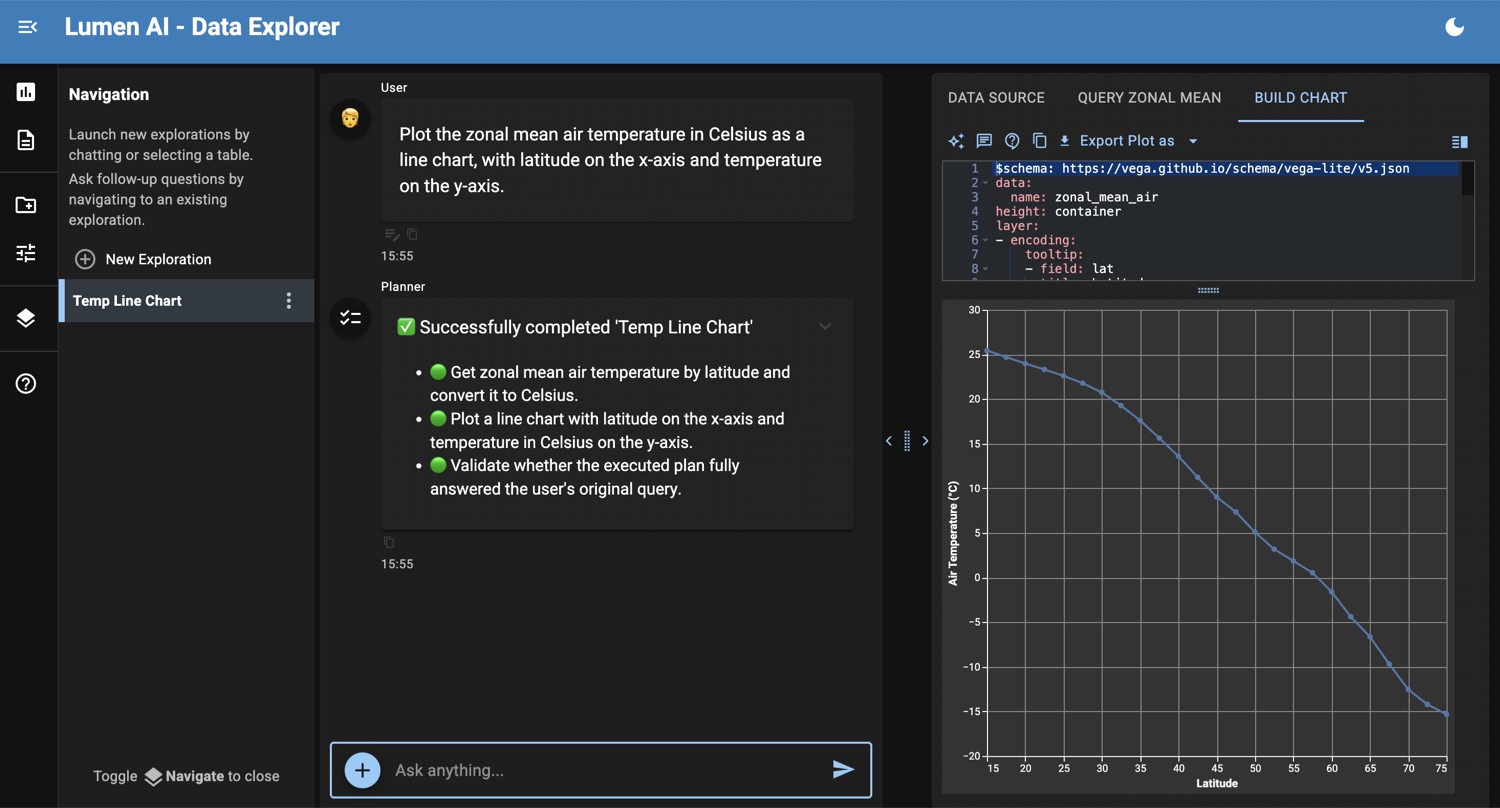
The result, end to end. Drop a NetCDF file into Lumen AI, ask a question in English, get a chart. No glue code, and the coordinates survive the trip.
The problem
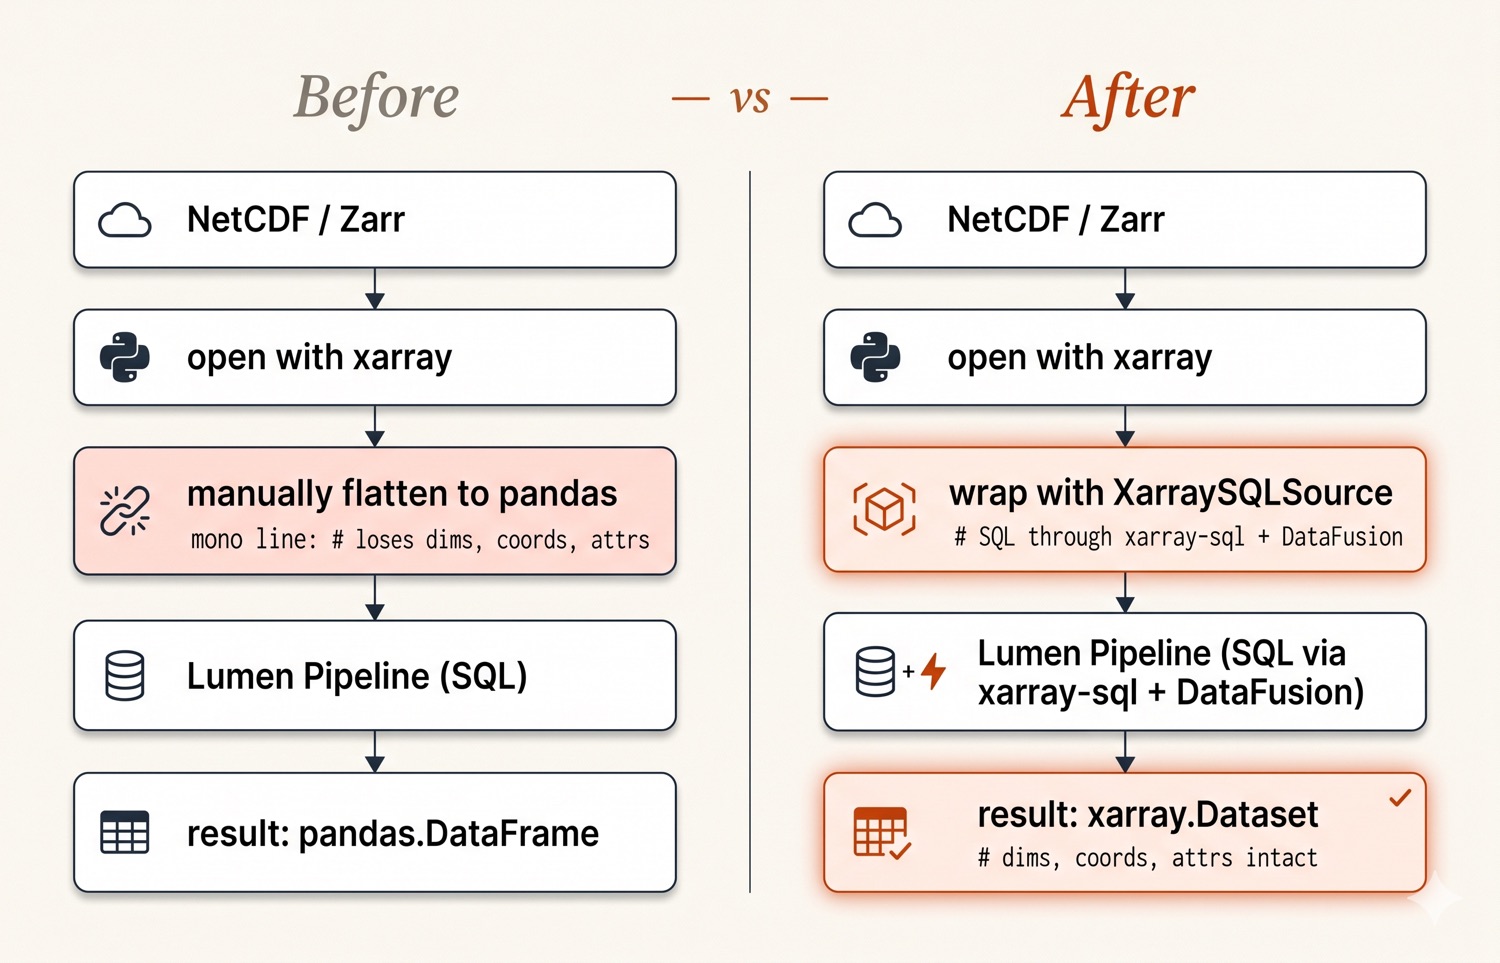
A cube goes in, a flat table comes out, and the coordinates are gone
A climate scientist has a NetCDF file: sea surface temperature over latitude,
longitude and time. They want to ask, in plain English, what the average was in
the Pacific in January 2020, and get back a table and a map.
Lumen turns a declarative spec into a data
app, and Lumen AI lets you talk to your data. Both assume the data is a flat
table. xarray is the Python tool for data that is
not flat. Before this project, connecting the two meant an afternoon of pandas
glue that flattened the cube and threw the coordinate metadata away on the way in.
Once lat and time are just two more columns of floats,
nothing downstream can tell a map from a scatter plot.
Closing that gap was the whole project. It turned out to be three problems, not
one: getting the cube into Lumen, getting a chart that respects the grid back out,
and making the SQL engine in between stop losing the labels.
What flattening costs. Left, the cube as xarray holds it. Right, what every downstream tool used to receive.
The stack
Where the work landed
Lumen sits on xarray-sql,
which sits on Apache DataFusion. Roughly a third of this project was spent below
the Lumen line, because most Lumen bugs I chased turned out to be one layer down.
The arrow back up the stack, to_dataset(), did not exist when the
project started.
Using it
What this looks like from the outside
The point of all of it is that the glue code goes away. A NetCDF, Zarr, HDF5 or
GRIB file becomes SQL tables, one per data variable, with the coordinates as
columns and the metadata still attached.
Python
pip install "lumen[xarray]"

from lumen.sources.xarray_sql import XArraySQLSource

source = XArraySQLSource(uri="air_temperature.nc")
source.get_tables()
# ['air']

source.execute("SELECT lat, lon, AVG(air) FROM air GROUP BY lat, lon")
import xarray_sql as qr

ds  = xr.open_dataset("air_temperature.nc", chunks="auto")
ctx = qr.from_dataset(ds)

# lazy: the isel below becomes a DataFusion filter, not a full read
out = ctx.sql("SELECT * FROM air").to_dataset()
out.isel(time=0).air.plot()
Or skip the code entirely
lumen-ai serve air.mon.ltm.nc

# then ask: "plot the mean air temperature over lat and lon as a heatmap"
Shipped, not just merged
This is in software people have installed, which matters more than a green merge
badge. Of my 76 merged Lumen pull requests, 51 are in a tagged release already and
the remaining 25 are on main awaiting the next one.
the cftime projection fix found by driving Lumen at real climate files
What I built
Eight workstreams, and the papercuts underneath them
Nothing here landed as one big pull request at the end. Each item is its own
reviewable change, which is why there are so many numbers.
A · Source
xarray as a first class Lumen source
XArraySQLSource exposes every data variable of a NetCDF, Zarr, HDF5
or GRIB dataset as its own SQL table, with coordinates as columns, queried
through DataFusion. It reuses Lumen's existing BaseSQLSource schema
inference and caching rather than inventing a parallel path, and it is behind an
optional dependency so a plain Lumen install stays light.
The AI side came next: agents that can read an N-dimensional schema, and file
upload so a scientist can drag a .nc file into the chat and query it.
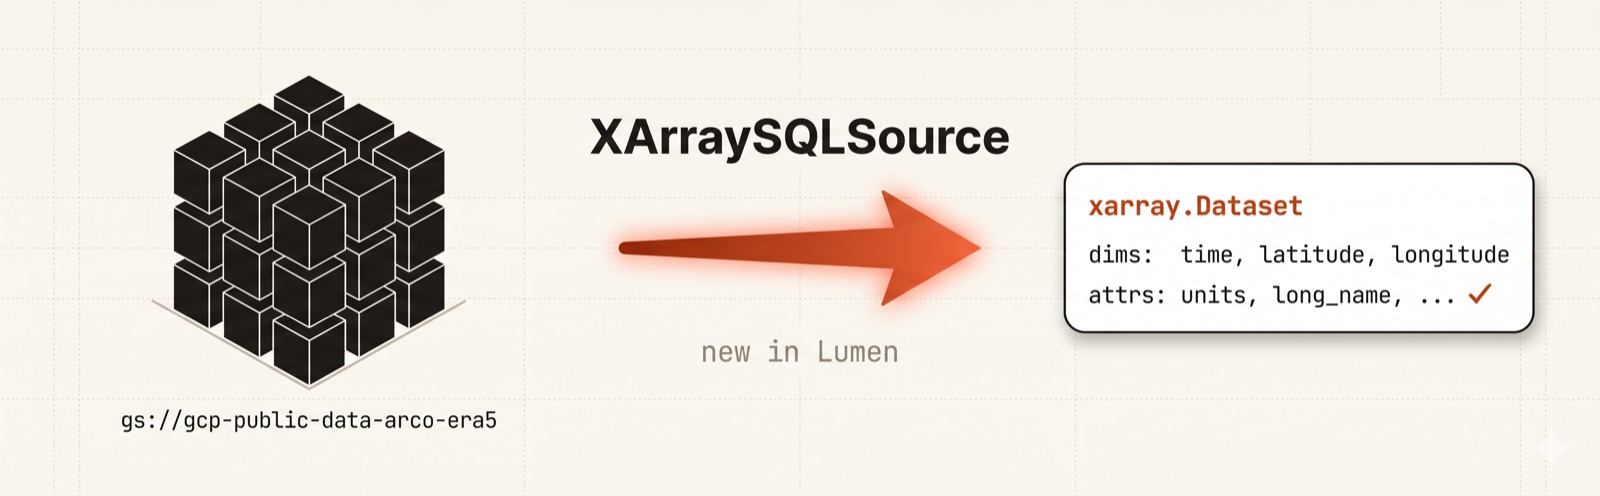
A cloud Zarr store in, an xarray.Dataset out, with dimensions and attributes still attached.
B · Gridded plotting
A grid that renders as a grid
Getting the data in was not enough. Asked for a temperature map, the AI would
produce a scatter plot or an empty chart, because nothing told it the result was
a field. This taught all three rendering backends about grids: hvPlot gained
quadmesh, image, contour and
contourf, Vega-Lite gained a rect heatmap path, and DeckGL gained a
ColumnLayer with a row guard so a 2M cell grid cannot lock a browser tab.
I opened this as three pull requests and closed two of them. Reviewing my own
split, the prompt changes and the render changes could not be tested apart, so
#1824 and
#1825 folded into
#1823.
A gridded XArraySQLSource answered with a rect heatmap, chosen by the agent rather than configured.
C · Upstream
Making xarray-sql able to carry it
Thirteen pull requests into xarray-sql, eleven merged, shipped across releases
0.3.0 to 0.3.3. Registration crashed on string coordinates
(#153), on scalar variables
(#169, a GOES-16 file with
124 variables of which 89 were scalar), on object-dtype and out-of-range datetimes
(#224). Dimensions without
coordinates were silently dropped from the schema
(#216), and aggregations
could not round trip at all
(#218).
Every one of those was found by driving Lumen at real data and following the
traceback down a layer.
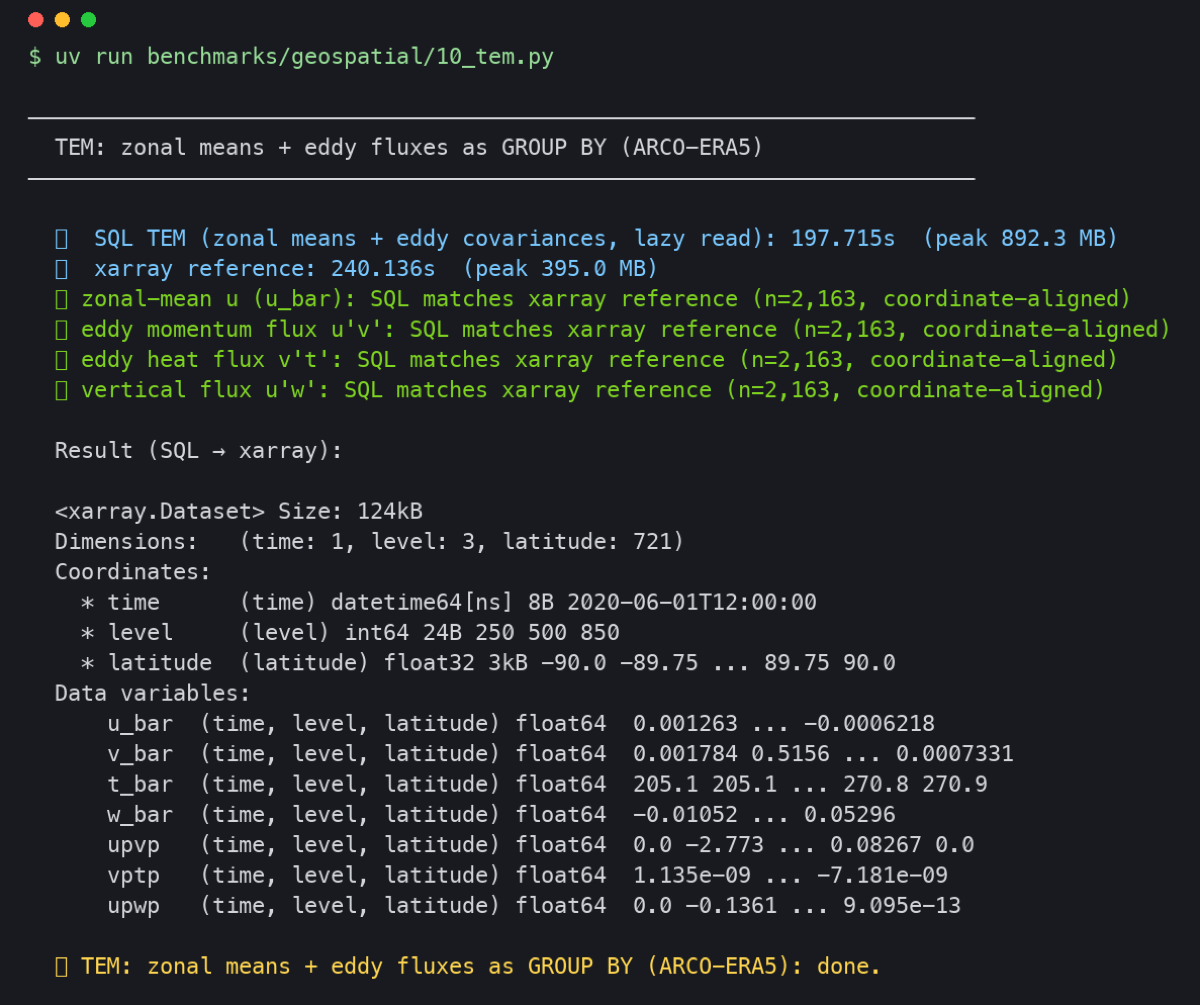
The benchmark I added in #191: zonal means and eddy fluxes over ARCO-ERA5 expressed as one GROUP BY, checked against a pure xarray reference and round tripped back into a Dataset.
D · Backends
Pipelines that are not hard‑wired to pandas
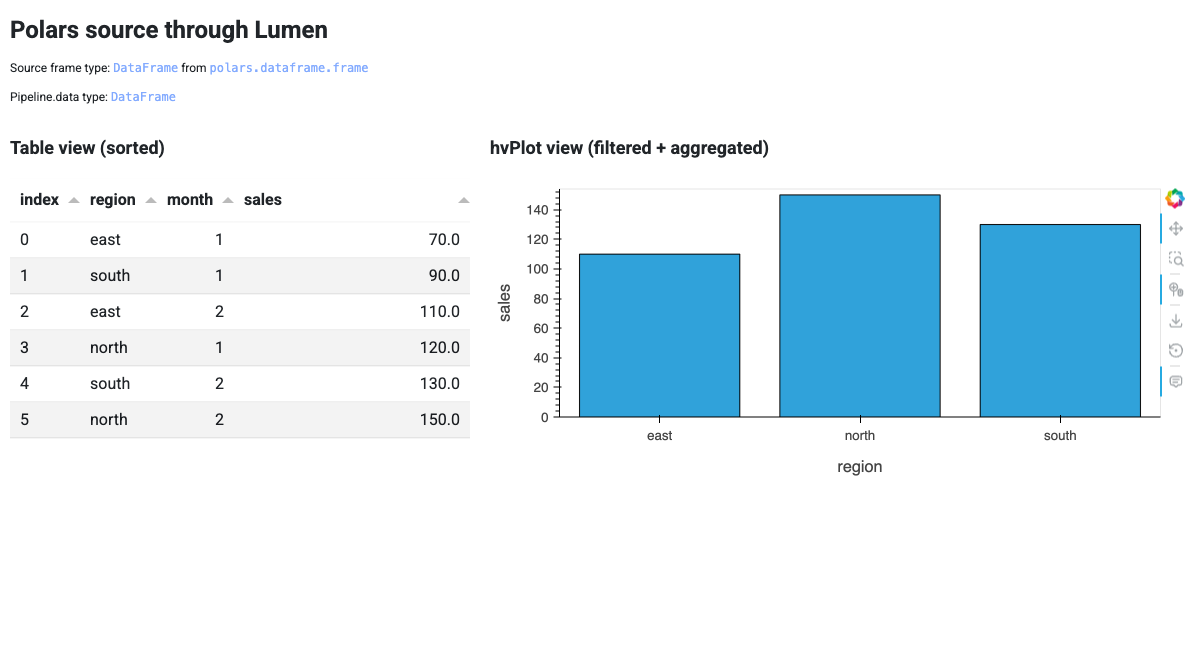
Lumen assumed pandas everywhere. #2008
introduced narwhals so a
source can return polars or pyarrow: schema generation, Filter and
nine transforms now run natively, with a logged pandas fallback for what narwhals
cannot express. I measured the rest rather than assuming it: 9 of 24 transforms
are narwhals-native, and narwhals has no corr or
transpose, so three transforms are not portable today.
The fallback then turned out to be lossy, not cosmetic. A polars
Int64 of 4611686018427387905 came back as
4.611686018427388e+18, silent corruption on any ID column
(#2046). The first regression test
I wrote for it passed before the fix, because comparing through float64 rounds
both sides.
A polars frame flowing through the pipeline without a pandas conversion.
E · Filtering
Filters that know about coordinates
Lumen's filters target tabular columns. For a cube the natural axes are
time, lat, lon and
pressure_level. This picks up the maintainer's draft at
#1599 and completes it:
an Add Filter menu that surfaces coordinate dimensions first, routed through the
existing filter pipeline rather than a parallel one, plus an
apply_filter tool so the chat agent can do it too.
Latitude offered as a filter axis because the source knows it is a coordinate, not a column of floats.
F · Geospatial
Geometry that survives the round trip
Requested by my mentor part way through, and closely related: a GeoDataFrame is
another shape Lumen used to flatten. The root fix is in
get_dataframe_schema, so the schema recognises a geometry column at
all; then DuckDBSource rebuilds the GeoDataFrame from native
GEOMETRY via ST_AsWKB, and the agents route on the
reported CRS, geographic to a basemap and projected to a flat plot.
Along the way I proposed a theory that hvPlot hangs on geometry serialization,
reproduced it, and found it was wrong. That negative result is why Panel
#8664 is a general Panel
improvement and not a Lumen dependency.
The visible result is that uploading a GeoJSON and asking for a choropleth now
returns a map. Before it returned a blank panel with no error, which is the worst
kind of failure because there is nothing to search for. Loading
.geojson, .wkt and .shp at startup
(#1905) and rendering a table's own
geometry as a Vega-Lite geoshape
(#1998) came out of the same thread.
Ask for a choropleth, get a map. Before this it returned a blank panel with no error, which is the worst kind of failure because there is nothing to search for.
G · Catalogs
One command instead of a 4 GB download
The onboarding story I wanted was lumen-ai serve --catalog <stac-url>
rather than "first download this 4 GB NetCDF, then write a YAML file".
STACSource delivers it: it takes a STAC API endpoint, lists the
catalogued datasets to the agent, and instantiates an
XArraySQLSource underneath with no further configuration, so a
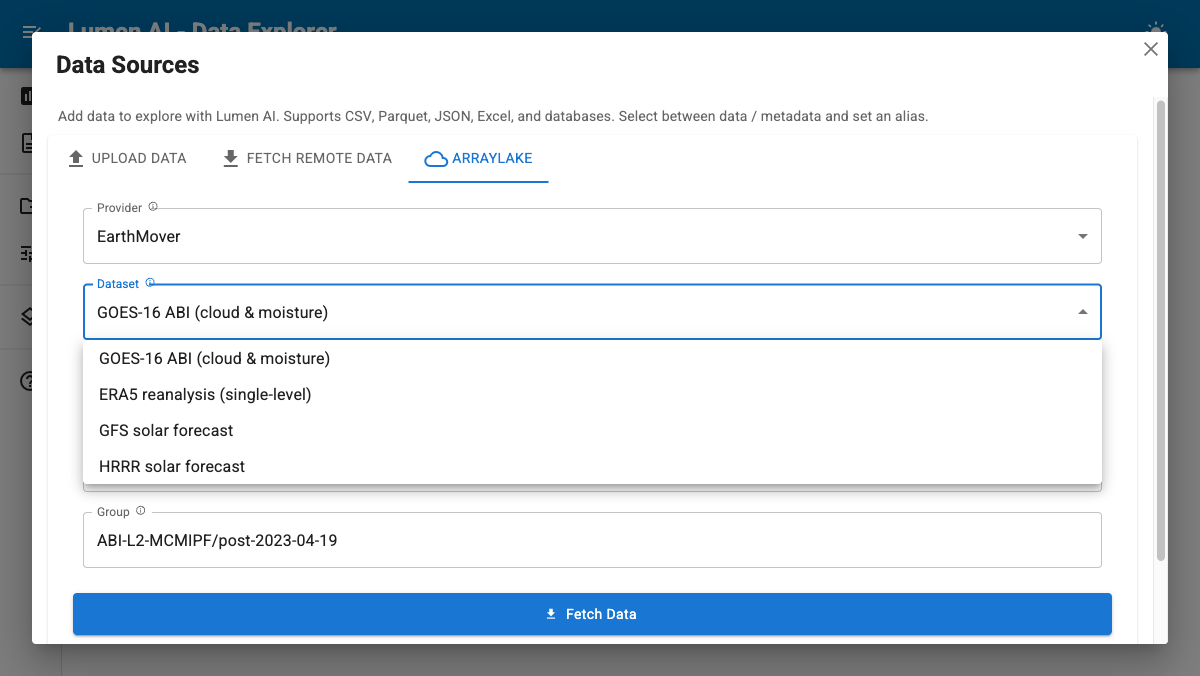
Zarr-backed collection is queryable in one command. A companion control does the
same for Arraylake, which is what
xarray-sql #169 unblocked.
Both are open for review rather than merged. COG-backed collections still route
through a stackstac fallback that is not written, and I filed the upstream change
that turns an opaque AttributeError from inside xarray's backend into
a clear error at
xpystac #69. Reviewing my own
work, I would rather hand over a source that fails loudly on the formats it does
not support than merge one that fails silently.
Pick a cloud dataset by name instead of configuring a URL. GOES-16 is the store that xarray-sql #169 made registerable in the first place.
H · Extension
A whole package built on the extension points
lumen-ourworldindata
lets Lumen explore Our World In Data, the
public research database behind most global development questions. Roughly 12,200
charts are reachable, plus the much larger indicator catalog behind them. Nothing is
downloaded: OWID serves CSV and parquet over plain HTTPS and DuckDB reads those in
place, so the package supplies the discovery, the metadata a model needs to pick the
right series, and the reshapes that OWID's country and year tables always want.
It is on this page because it is the proof that the extension surface holds. Every
piece of it, the source, the OWIDTimeSeries view, loading a chart by
slug or grapher URL, is written against Lumen's public extension points rather than
a fork, and an early review round deleted the bespoke views I had written in favour
of an extending-Lumen guide that shows how to build them. The repository has since
been transferred into the HoloViz organisation.
Asking a plain English question and getting an answer computed from OWID's own
series. Source, docs and the full demo:
holoviz-topics/lumen-ourworldindata.
47 commits · sole contributor · 11 pull requests, all merged
I · Everything else in Lumen
The papercuts, which is how I earned the right to do the rest
The largest bucket by count is not the headline work. It is 75 pull requests of
ordinary maintenance: reports that export to HTML, Word and notebook, an AI
written story annotation, a data cleaning mode for the SQL agent, multi-chart
responses, a fixed retry loop, an explain-query button, and a long
tail of one line crash fixes. Starting here in March is how I learned the codebase
well enough to be trusted with a 350 hour project, and it is where 56 of the merges
on this page live. A representative selection:
xarray-sql could turn a Dataset into SQL tables. It could not turn a query result
back into a Dataset. That was
issue #58, open
since 2025, and it was the piece Lumen needed most: without it every query result
comes back as a flat frame and Lumen has to guess the grid again.
Rewrite one: it was not lazy
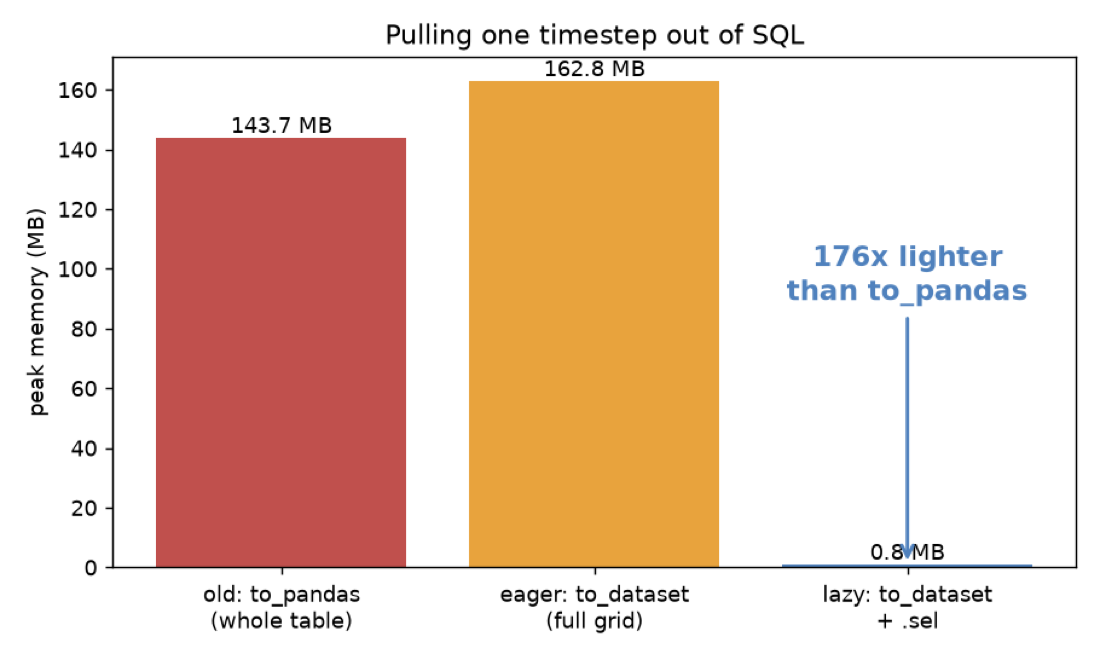
My first version worked and was useless. It pulled the whole result through pandas
and called set_index().to_xarray(), which means asking for one time
slice of a 20 GB store reads 20 GB. The rebuild put a real
xarray.BackendArray underneath, wrapped in
LazilyIndexedArray with IndexingSupport.OUTER, so an
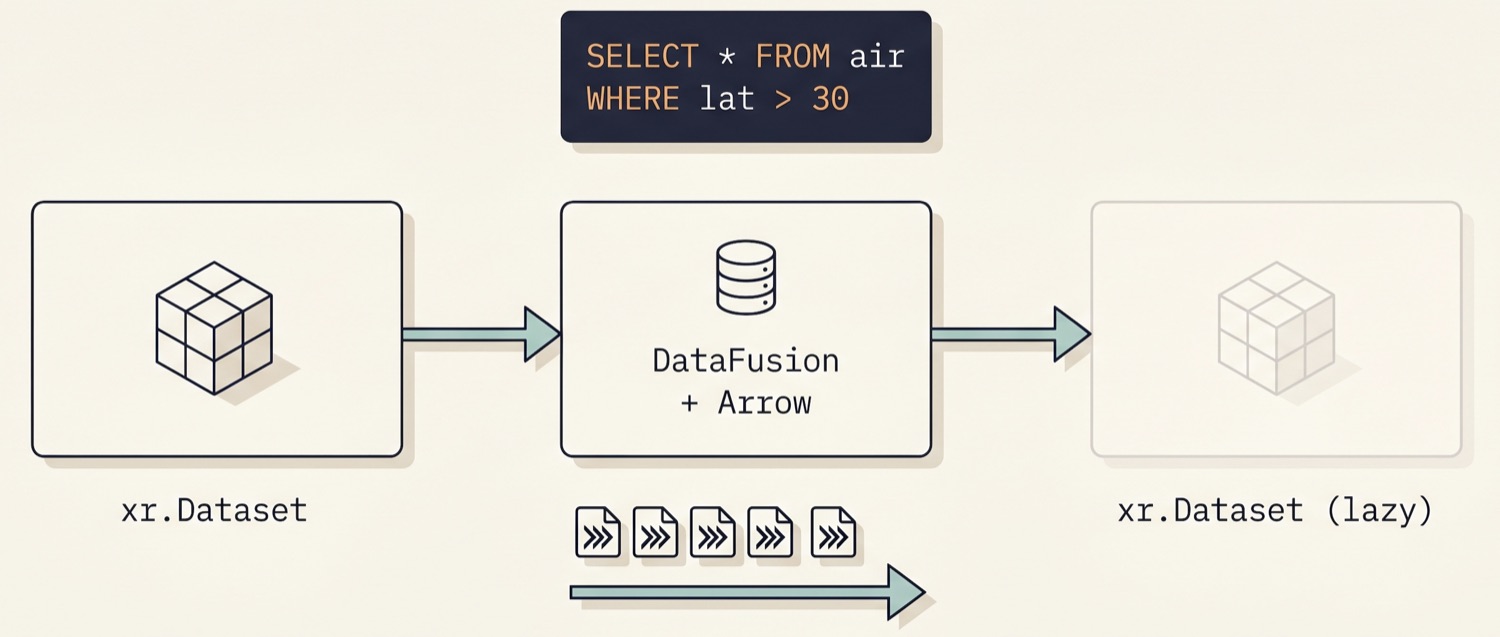
isel or sel becomes a DataFusion WHERE clause
and Arrow record batches scatter straight into a numpy buffer with no pandas hop.
Rewrite two: the reviewer found a regex
To restore the attributes, encoding and non-dimension coordinates that a flat pivot
destroys, I needed to know which registered Dataset a query came from. I was
parsing the FROM clause with a regular expression. That survived
exactly one review round. Resolving it through the live DataFusion DataFrame
reference instead was a net +177/-361: the correct version was smaller
than the clever one.
Rewrite three: real data, fourth review round
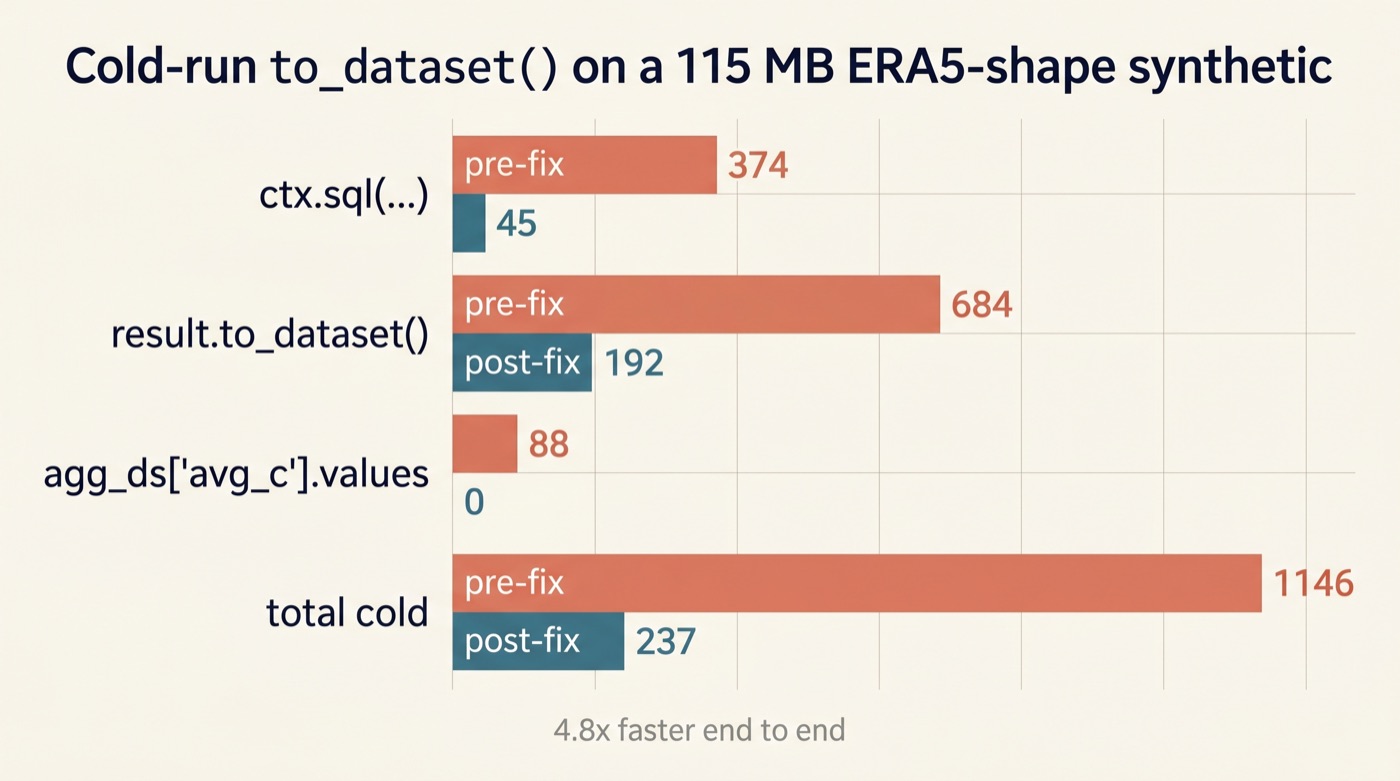
Benchmarked on a synthetic ERA5-shaped store it was fine. On the real thing it was
slow, and the profile showed why: to discover which coordinate values survived an
aggregation, the code re-ran the whole GROUP BY once per dimension.
On a local file that is wasted CPU. On a cloud Zarr store each one is a network
round trip. #193 detects the
unfiltered-scan case in the query plan and reuses the registered coordinate arrays
instead.
The lazy path after rewrite one. An isel becomes a WHERE clause; Arrow batches scatter straight into numpy.
Cold cache, 115 MB ERA5-shaped store: 1146 ms to 237 ms.Peak RSS on air_temperature: +194 MB eager, +17 MB lazy.
Twenty commits, four review rounds, three rewrites, and the version that merged was smaller than the version that did not.
Shipped in xarray-sql 0.3.0 with 48 new tests. The discovery-scan fix on top
took construction from 3.4 s to 7 ms and peak memory from 77 MB to 0.1 MB on
air_temperature. Two follow-up pull requests added opt-in
integration tests that assert the memory ceiling holds
(#199), and then fixed
those tests when they proved flaky because DataFusion's peak scales with the
runner's core count (#222).
Deep dive two · lumen #1943
The tests passed and the real data did not
#1823 merged with a full test suite
and I believed it worked. Then I ran lumen-ai serve against actual
climate files, NOAA air.mon.ltm with a cftime calendar and a bounds
variable, and an ERA-40 file with ordinary datetime64, and read the tracebacks.
Six bugs, all in code I had already merged.
cftime broke regularity detection._is_regular used
np.allclose, which adds a floating point tolerance to a datetime
step. Fine on datetime64, wrong on cftime objects.
A map showed twelve months at once. A gridded subset left cftime
dimensions uncollapsed, so a lat/lon map carried all 12 monthly slices,
2.1 million rows of them.
Two different list.index(x): x not in list crashes in
to_dataset: once from passing a bounds dimension, once from a
sql_transform that projected time away. Generalised to
passing only dimensions present in result.schema().names.
One bug was not in Lumen at all. A projection that drops a cftime
coordinate crashed batch reading upstream, which became
xarray-sql #230. Only
cftime hit it, because datetime64 skips that branch entirely.
The sixth bug produced no error at all. It just returned the wrong numbers.
subset_gridded_to_2d pinned every dimension that was not being plotted
to a single slice. That is correct for a heatmap. It is wrong for a Vega-Lite spec
that aggregates over those dimensions, because pinning first means Vega averages one
cell and reports it as the mean. No exception, no warning, a plausible chart with
the wrong values. The fix in
#1944 checks the spec for an
aggregate before collapsing, and carries a documented ceiling: it sends the full
grid to the browser.
I put this section on the page deliberately. A green test suite told me the feature
worked; one afternoon with a real file said otherwise. Every dataset I have used
since is a real one.
A zonal mean computed in SQL over real reanalysis data, after the cftime fixes.
The proposal, scored
Where every goal landed, with the code behind it
Five goals are delivered and merged. Two of those went past what I promised: the
xarray-sql round trip closed a year-old upstream issue and then kept going for ten
more pull requests, and the agent work grew from reading an N-dimensional schema
into rendering it correctly on three chart backends.
Two more are written and open for review. One moved: Vega-Lite has no seam for
xarray, which I confirmed by investigating it upstream, so I solved the same user
problem inside Lumen where the seam does exist. The last is partial and the table
says which part.
Proposal goal
Outcome
Evidence
1. DataFrameLike param type
Written, in review
A parameter type that accepts any narwhals-compatible frame, so the whole HoloViz ecosystem can declare "this holds tabular data" once.
2. Rework Lumen pipelines onto narwhals
Delivered
Sources can now return polars or pyarrow. Schema generation, Filter and nine transforms run natively.
3. Translate xarray-sql output back to xarray
Delivered, exceeded
Closed issue #58 after 3 rewrites, then 10 more upstream pull requests.
4. Implement an xarray source for Lumen
Delivered
Merged before the coding period opened.
5. Extend Lumen AI agents for N-dimensional data
Delivered, exceeded
Grew from reading an N-dimensional schema into rendering it correctly on hvPlot, Vega-Lite and DeckGL, verified against real climate files.
6. Better xarray support in Vega-Lite
Solved elsewhere
Investigated and reported on altair #891: narwhals has no xarray adapter and xr.Dataset exposes no Interchange Protocol, so there was no clean upstream seam. Solved inside Lumen instead.
8. End-to-end tests on real scientific datasets
Partial
Real NOAA and ERA-40 climate NetCDF drove the whole six bug hunt, and upstream gained opt-in tests that assert the memory ceiling holds on real data. AnnData and microscopy stacks were not covered.
Additional. STAC / Pangeo Forge catalog source
Written, in review
lumen-ai serve --catalog <stac-url> works end to end on Zarr-backed collections. COG collections need a stackstac fallback.
Picked up the maintainer's draft and finished it: coordinate dimensions offered first in the filter menu, plus an apply_filter tool for the agent.
Contribution index
All 167 pull requests
Read from the GitHub API on 23 August 2026. Merged means merged. Filter by
workstream, state or repository, or click a cell in
the field above.
Date▾
Repository▾
PR▾
Title
State▾
Workstream▾
Diff▾
Issues reported — 74 across 8 repositories
Bug reports and design proposals I filed. Many were fixed by someone else, several
by me in the pull requests above, and the open ones are the honest backlog.
Date
Repository
Issue
Title
State
Wider ecosystem — outside the GSoC project
Work in neighbouring projects during the same period. It is not part of the GSoC
deliverable and I list it separately so it does not compete for attention, but the
Bokeh and xarray items came directly out of debugging this stack.
Bokeh. The downstream CI job could not report failure. It had returned
green for eight weeks while Panel's suite failed hundreds of times a week and
the HoloViews step never ran at all.
xarray.to_zarr(append_dim=...) silently mislabels data
when the incoming coordinate does not align with the store.
CPython. Argument Clinic checked docstring width on signature lines but
not on parameter descriptions.
ipywidgets.interact_manual ran on text-field blur, not
only on submit.
panel-material-ui, Panel, HoloViews, hvPlot. Chat message editing,
Tabulator header filters, ECharts crashes, a Bars datetime crash, and heatmap
row counting.
NumFOCUS and listings. Broken links in the GSoC README, the blogs entry,
and adding Lumen to two ecosystem lists.
Acknowledgements
Thank you
Andrew Huang and
Andy Maloney mentored this, reviewed a great
deal of code, and were consistently specific rather than polite about what was wrong
with it. Andrew was on Discord more or less throughout, reviewing, guiding and ideating
out loud with me rather than only at review time, and several items on this page exist
because he filed the bug or asked for the feature. lumen-ourworldindata started in one
of those conversations.
Philipp Rudiger reviewed and guided work
across both Panel and Lumen and stepped in wherever it was needed, on plenty of
changes that had nothing to do with my project.
James Bednar,
Demetris Roumis and
Simon Hansen reviewed, triaged and answered
questions throughout, in issues, on the biweekly calls and on Discord, where someone was
reliably around when I was stuck. The wider HoloViz community answered plenty more.
Alex Merose maintains xarray-sql and reviewed
thirteen pull requests from a stranger, including one he sent back three times and was
right to. Marco Gorelli and
Francesco Bruzzesi reviewed the narwhals
contributions and were exacting about the standard for both.
Thanks to HoloViz, NumFOCUS and Google Summer of Code for the time to work on this
properly rather than in the gaps.